School Closure Data Revised by Professors

Introduction
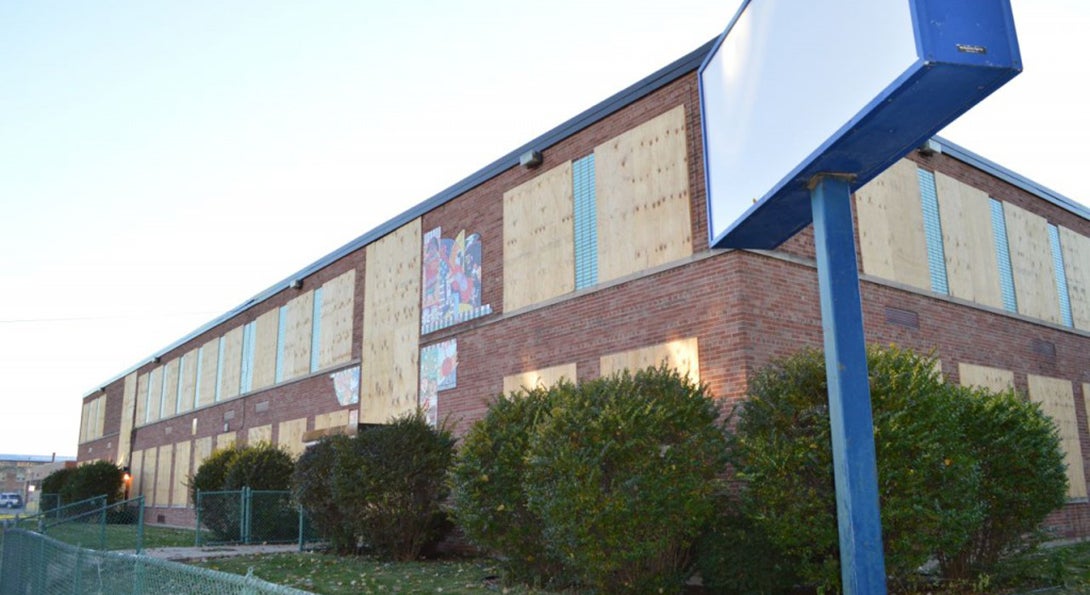
There seemed to be only one thing Chicago Public Schools and the Chicago Teachers Union could agree upon in regards to CPS school closures: the schools had definitively been closed.
What those closures meant in the spring of 2013, however, is still up for debate. Neither CPS nor CTU could agree upon how many teacher positions were eliminated, how many students with special education needs were impacted or even how many students in total were affected. That’s where the College of Education’s Josh Radinsky, PhD, associate professor of curriculum and instruction, and Federico Waitoller, PhD, assistant professor of special education, entered the conversation.
Their work with spatial mapping literally redefined CPS’ estimates of the impact of school closures. Radinsky and Waitoller found the total number of students affected was underestimated by 42% by CPS, and the two used community mapping to demonstrate the disproportionate effect closings have had on African American students.
“We think of schools in terms of neighborhoods, but we rarely look at data in terms of neighborhoods,” Radinsky said. “With geographic information tools, we can look at the different geographies schools are a part of, the mobility of teachers from school to school and the mobility of children from neighborhood to neighborhood.”
The school closings impacted 133 schools serving more than 47,000 students. Breaking down the data, Waitoller and Radinsky found that nearly 15 percent of students impacted were enrolled with an individualized education program (IEP), while 27 percent of all African American children in the city were affected by closings. This data mining led Radinsky to testify to the Chicago Public Schools Board of Education that the closings are “primarily a policy for Black Chicago, specifically in West side and South side neighborhoods.”
“Most of the media and most of the people in CPS talk about school closings, but the actions are much broader,” Waitoller said. “The implications are across the spectrum: how do they impact differently different kinds of students?”
To that end, Waitoller and Radinsky are building a large database to be updated annually in order to produce timely data and maps for use by CPS decision-makers. The two hope stronger data can help answer some of the sticky questions brought about by the school closings. In particular, the two hope to explore:
-How will racial segregation be impacted in the City of Chicago?
-Will schools grow more racially concentrated?
-With non-white students disproportionally represented in special education, how will shifting students with IEPs impact racial isolation and segregation?
The need for quick data is underlined by the rather rapid decision-making process undertaken by CPS to close down such a large number of schools. Policymakers tend to move at a faster pace than researchers.
“The cycle between gathering data and reporting findings is such a long process which often leaves educators and policymakers out in the cold,” Radinsky said.
What will educational data collecting look like in the web 2.0 world? Waitoller and Radinsky see a growing role for citizen researchers who gather their own data in an attempt to sway CPS decision-making. While “do-it-yourself” data naturally is regarded with a degree of suspicion, the two say Chicago-area groups such as Apples to Apples, Raise Your Hand and More than the Score have produced sophisticated data that in some instances is more accurate than data reported by the media.
Waitoller and Radinsky plan to expand their data collection work to examine other CPS school actions, including the recent request for proposals to open new charter schools, and how the opening of new charter schools impacts the enrollment of neighborhood schools, the availability of services for students with disabilities and how that affects the amount of time available in both special education and integrated general education classrooms.